An overview of the index status page
This topic explains what you see on the status page in the Index Manager configuration.
Accessing the configuration
When Index Manager is installed, there will be a link to Operations Center Status and Index Manager Settings on the desktop. Operations Center Status displays the status and logs for all of the installed Fotoware apps on the server, while Index Manager Settings is used to configure the indexes and their settings.
To open Index Manager Settings (see below) you need to be a member of the Fotoware Administrators group.
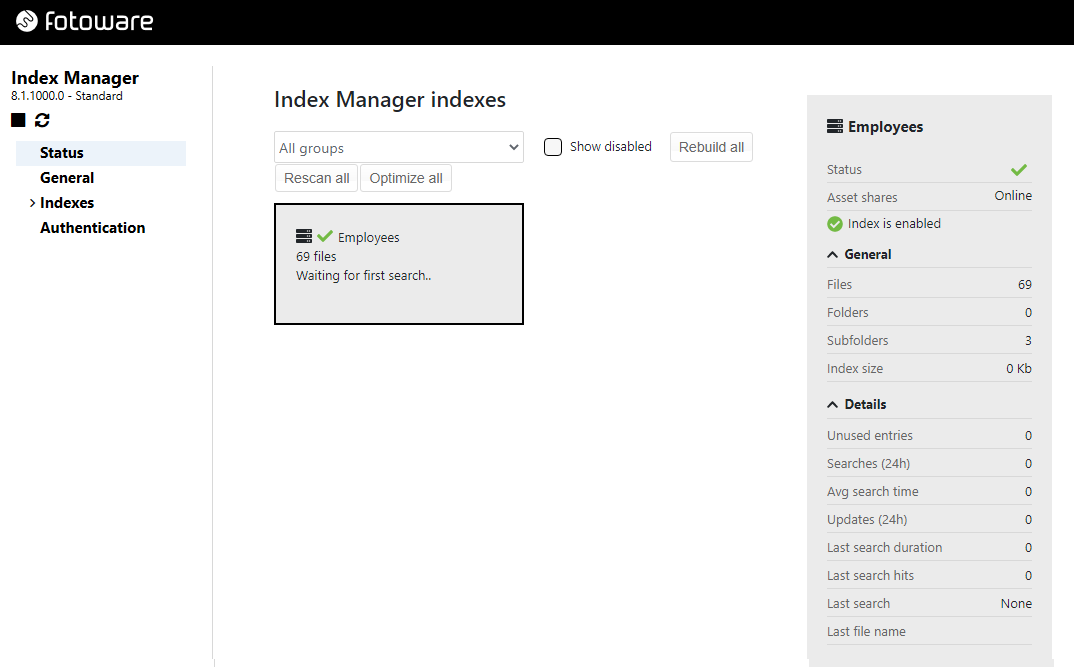
Status
The Status node displays the same activity information as the plugin in the Operations Center. It shows a grid of all the configured indexes and a status panel on the right side of the screen.
Service actions
![]()
With the Service actions icons (outlined in red above), you can start, stop and restart the Index Manager service. Index Manager cannot receive searches from clients when stopped so we recommend stopping/maintaining the service at non-critical hours.
Index actions
With the Index actions icons, you can manually rebuild, rescan, or optimize indexes.
Rebuild: Choose an index in the list and select Rebuild to delete all existing index data and completely rebuild the index. Rebuilding the index can be a time-consuming operation if it contains many files and should typically only be done outside office hours to avoid rendering the system temporarily unavailable.
For more information, see Rebuilding an index.
Rescan: Choose an index in the list and select Rescan to scan all document folders added to an index to make sure all files are correctly added to the index and made searchable.
For more information, see Rescanning document folders in an index.
Optimize: Choose an index in the list and select Optimize to defragment the index by removing unused index entries. This reduces the size of the index and makes it possible to perform faster searches. An automatic optimization schedule can be set in the Index Manager configuration. You can access this by selecting Configure in Operations Center.
For more information, see Regularly optimizing indexes for performance.
Information in the index grid
The index grid shows all indexes and unions that are configured on the server. From here you can read out the index name and the number of files in the index, see the last search request to the index, and the last update (the last file that was added to the index). You can read out the full path to the last updates file by hovering over the Last update field.
Use the Group filter to choose which indexes you want to display. Select Show disabled checkbox to also display indexes that have been disabled.
The indexes light up when there is activity to make it easy to monitor server activity.
A failing index is marked to indicate that something is wrong. For example:
- a union that turns yellow has lost its main index and has switched to the backup index
- an index that turns red has lost contact with the indexed folders, for example, because a file server is unavailable.
When errors occur, you can find more information about the problem by selecting the relevant index and checking the Status field in the panel on the right.
Index information panel
You can get more information about each index by selecting it and reading out more information in the panel on the right.
Status - indicates if an index is being built or updated, when it's ready for search, and provides troubleshooting information when relevant by turning yellow or red.
General - the number of indexed files, folders, and subfolders, as well as the actual size of the index folder where the index is stored. The bar chart shows the number of searches in the index during the last 24 hours. The graph runs from 0:00 to 24:00 midnight and the yellow bar indicates the current time of day. A similar bar chart gives you an overview of the number of new files in the indexes in the last 24 hours.
Details - valuable information to evaluate the server response:
Unused entries - an indication of fragmentation in the index and whether an index optimization would be in place. Read more about that here.
Searches (24h) - how many searches have been made in the index in the last 24 hours.
Avg. search time - the average time it takes to process a search in the index.
Updates (24h) - how many files have been added to the index in the last 24 hours.
Last search duration - how much time the last search took.
Last search hits - the matches from the last search.
Last search - the last search that was made in the archive.
Last file name - which file was last added to the index. Hover over this field to display the full file path.